
Once again, we take a look at ICT’s monthly tourism statistics and try to glean some meaning from them. While November doesn’t look as exciting as October did (at least, as a chart point), the eleventh month was still the 4th best month of 2019 for growth. Our conclusion? Growth is still positive overall, but not for everyone. Those who feel that they are are not seeing the benefits of growth might want to take clearer steps to adapt to the changing marketplace. We’ll review the current stats, and then talk about strategies for adaptation.
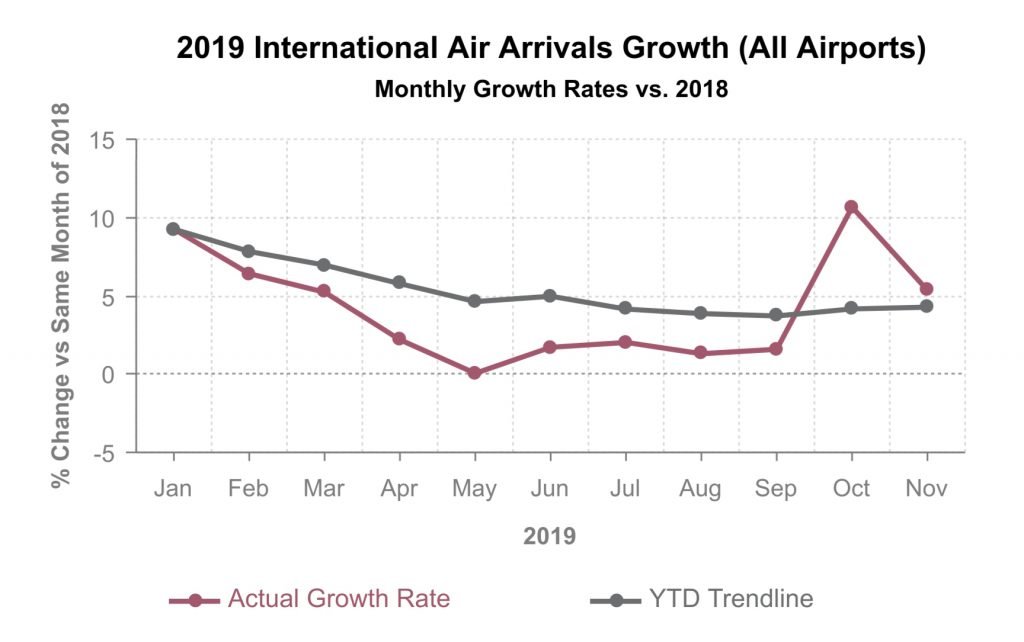
The caution of viewing statistics in a chart like this (Fig. 1) is that such snapshots can provoke emotional responses that aren’t necessarily logical. For instance, if October’s growth rate had been 4% instead of the 10.66% it really was, we’d now be looking at a chart that looks like this:
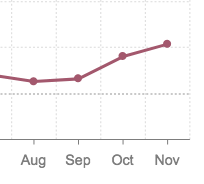
The hypothetical example in Fig. 2 seems more encouraging to us because the line trends only upward, but it actually represents less growth that the the real data shown in Fig. 1, which looks more dramatic with that downward (relative to October) line for November.
We humans evolved to pay more attention to potential dangers than to less immediately threatening things – why the papers are full of bad news rather than good news – but statistics didn’t feature as prominently to our early ancestors as did tigers and snakes.
This, combined with a tendency to confirmation bias (trusting news that reinforces what we already think, rather than what challenges it), is an example of why it behooves us in 2020 to examine data from all angles, and not to make the lookout for catastrophe become our only filter.
Back to the data: While November’s growth rate wasn’t as good as in 2018, at 5.35% it’s still a healthy, positive number (we wish we made that much interest on our retirement accounts last year!). The year-to-date cumulative growth rate for 2019 is 4.27%. That’s lower than 2018’s 5.4%, but better than the 3.8% we saw in 2017.
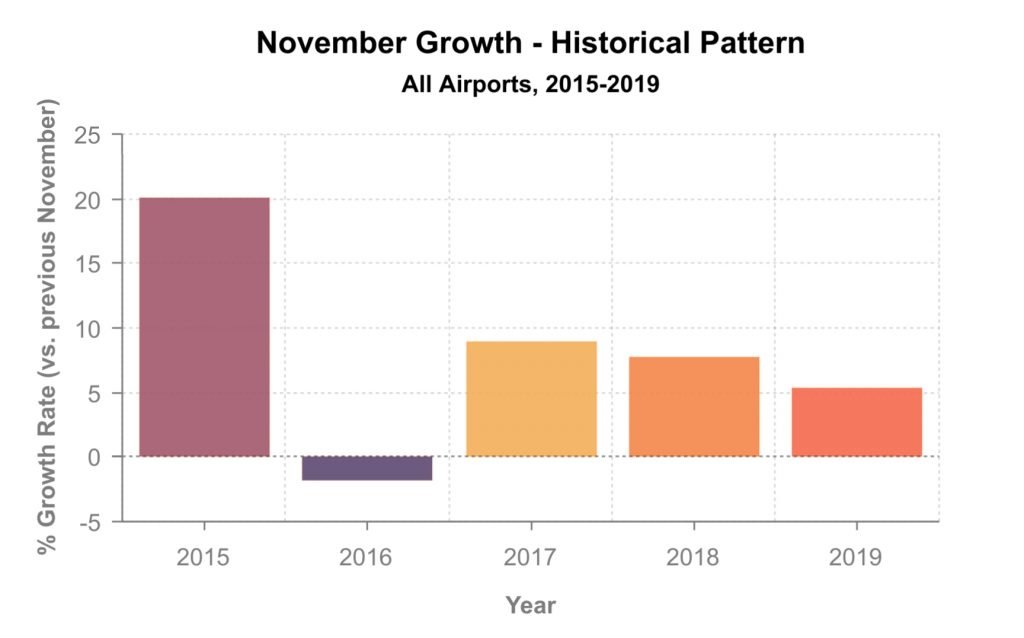
Here’s another way of looking at the numbers (Fig. 3). In this comparison of growth rates for the past five Novembers, a definite decline in growth appears to be a reality:
And yet, if you look at the number of actual arrivals (Fig. 4), things look pretty darn positive:
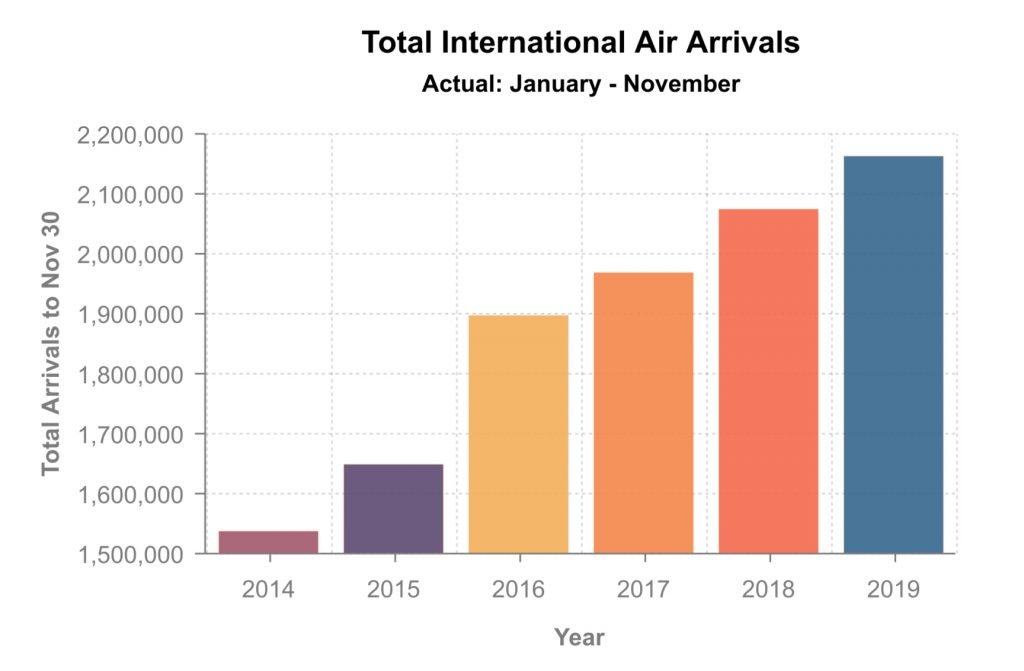
This is why it’s useful to look at both long- and short-term data. In Fig. 3, data is for just a single month, so volatility is amplified. It’s definitely important to know what the short term market dynamics are, which is why we share them with you. But the longer term data helps to put things in context, and can help us to make better strategic decisions in our tourism businesses.
Instead of just comparing this November with last November, let’s look at the average annual growth rates, January through November, for the past five years (Fig. 5):
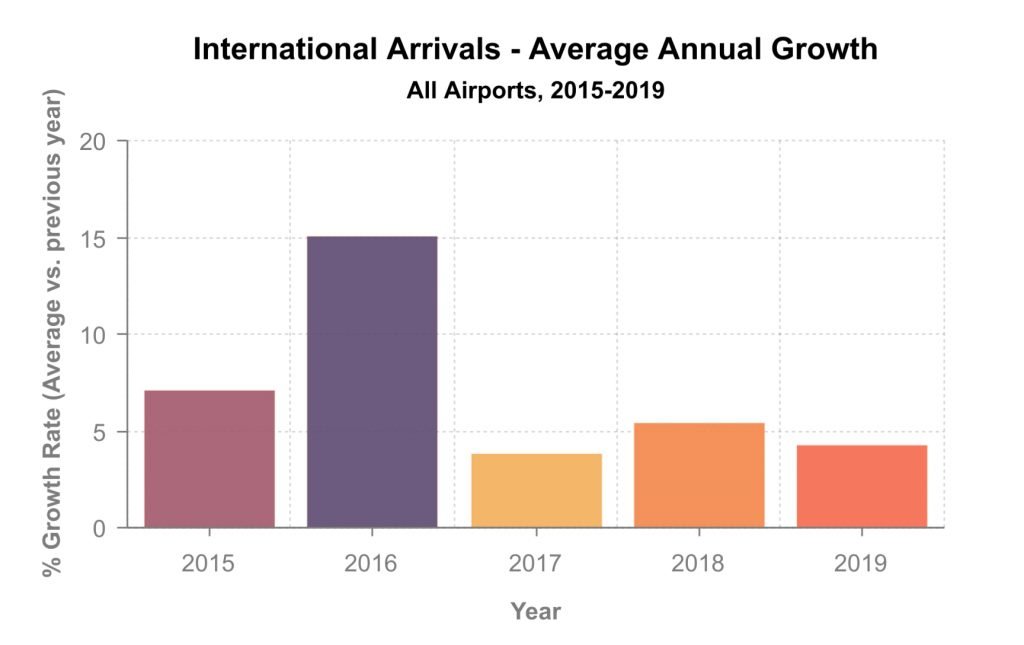
Look at the 2016 column in Fig. 3 again. One might conclude that the sky had fallen that year. But that was just one month (November). Overall (as shown in Fig. 5), 2016 was the best of the past five years for arrivals growth, by far, more than doubling the growth rate of any of the other four years.
What does it all mean?
Clearly, while more people are coming to Costa Rica all the time, the growth rate in arrivals does appear to be shrinking somewhat in recent years. While a small decline in arrivals growth should not have dramatic effects on the ground, concomitant factors may exacerbate the effects of shrinking growth. These might include, as many are quick to assume, the introduction of the General Sales Tax introduced earlier this year, regulations established to govern short-term rentals, or threats of labour disruptions.
There are other possible explanations as well, however, such as increased competition from other markets that attract the same clientele type, changes in airline pricing or policies that affect consumer choices, or global political and economic uncertainty that influences who travels to where and for what reasons.
We’d also be remiss if we failed to mention the monumental changes that have taken place in tourism marketing in the past decade. Technological Disruption has been among the big buzzphrases of this century so far, and tourism marketing has been no exception, with the likes of TripAdvisor, Booking.com, Airbnb, Google and others completely altering the way we attract and interact with potential customers.
When it comes to attracting customers, it’s no longer good enough for tourist businesses to do what always worked well in the past. It used to be that people would pick a destination (either through their own aspiration or as a response to a national marketing campaign) and then start planning the details of their trip. Because of the way people interact with less-concentrated digital content today, a traveller may be as likely to be inspired to choose a destination as a result of an individual hotel’s or tour company’s advertising as by a tourism ministry’s ad in a magazine.
We might not like it, but everything is changing, and those who fail to keep up with the times are at risk of being left behind. How will you become more innovative at attracting customers?
Download a PDF of the charts in this email to share with your team, here.


